Life plan communities (LPCs, also referred to as continuing care retirement communities or CCRCs) offer residents a unique value proposition. In addition to independent living residences, they generally provide a full continuum of care services to residents if and when they need them. While life plan community occupancy rates fared better than most other types of senior living during the pandemic, their numbers did decrease during the height of COVID-19. Now that we are several years removed from the pandemic’s onset, what is the outlook for life plan community occupancy?
A reliable source for life plan community occupancy data
National Investment Center for Seniors Housing & Care (NIC) is a non-profit organization that collects and analyzes data on senior housing and care. This is extremely valuable intelligence, which can be used to inform the decisions made by senior living operators as well as investors.
A vital information source for NIC’s insights comes from their partnership with NIC MAP Vision. NIC MAP Vision synthesizes primary source data on senior living communities’ occupancy, rent prices, supply and demand, and construction. They gather this information from over 16,000 independent living, assisted living, memory care, skilled nursing, and life plan communities (LPCs) located within 140 U.S. metropolitan markets.
Importantly, the dataset used by NIC MAP Vision includes over 1,160 life plan communities — both not-for-profit and for-profit, entrance fee and rental communities. Reviewing these analytics can offer an unbiased look at the state of the LTC sector as a whole, as well as how it is performing in comparison to the non-LPC senior living market.
In recent years, NIC has joined forces with Ziegler Investment Banking to gather even more market intelligence on the life plan community sector’s occupancy, growth, and other key datasets. Ziegler is a privately held investment bank, capital markets, and proprietary investments firm that specializes in the healthcare, senior living, and education sectors. A June 2024 article published by Ziegler gives the LPC sector reason to feel optimistic about its future.
>> Related: How Senior Living is Evolving to Meet Future Demand
Life plan occupancy rates for Q1 2024
The Ziegler article looked at occupancy numbers for the four segments found within a life plan community:
- Independent living
- Assisted living
- Memory care
- Skilled nursing
Ziegler factored in the latest NIC MAP® data from the first quarter of 2024, which was synthesized by NIC’s analysts. The numbers were then compared to figures from the first quarter of 2023 to determine changes and extrapolate trends.

The Q1 2024 data shows that overall occupancy within the life plan community sector continues to grow. The LPC segment with the highest occupancy in the first quarter of this year was independent living at 91%. That’s an increase of 1.1% from the previous year’s numbers.
Occupancy for the assisted living and memory care segments were fairly similar for Q1 2024, coming in at just under 89% of units occupied. But notably, both of these segments showed growth from the prior year — 2.8% growth for assisted living and 3.4% growth for memory care.
The segment with the lowest occupancy rates was skilled nursing communities, which are also referred to as nursing homes. This category of senior living community had 85.1% occupancy for the first quarter of 2024. However, the segment did still have year-over-year growth of 2%, showing that overall demand has risen for skilled nursing care.
>> Related: How a Couple’s CCRC Fees Adjust If One Person Requires Care
Digging deeper into the data
From this dataset, we can see that while the occupancy rate for independent living is the highest of all life plan community segments, interestingly, it has seen the lowest year-to-year growth among the four LPC segments. The largest year-over-year occupancy growth was experienced by memory care, followed by assisted living.
As the article notes, the growth trends we see in assisted living and memory care within life plan communities are consistent with what the senior living industry as a whole is experiencing. In other words, for assisted living and memory care communities that are NOT part of a life plan community, the year-over-year growth rates are similar to these LPC trends.
However, it is important to point out that according to the article, life plan community occupancy exceeded non-LPC community occupancy across all of these segments. The greatest difference can be seen within the independent living niche. For Q1 of 2024, the occupancy rate for independent living within life plan communities was 5.7% higher than the independent living occupancy for non-life plan communities.
>> Related: The Intersection of CCRC Finances & Occupancy Results
Regional, contract, and ownership differences
A few caveats to consider…
The article does point out that the figures are national, and variations can and do occur from region to region. Additionally, the author notes that the number of skilled nursing beds within life plan communities has decreased over the past several years, including a 1.6% decrease from 2023 to 2024. This reduced inventory should be factored in when comparing 1Q 2024 to 1Q 2023 skilled nursing occupancy.

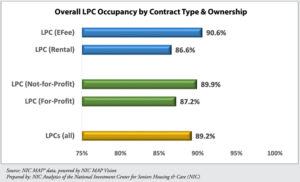
It is also important to understand that LPC occupancy varies by contract type and ownership — entrance fee versus rental communities and non-profit versus for-profit. For example, entrance fee communities reported 90.6% occupancy in Q1 2024 whereas rental LPCs had 86.6% occupancy in that same period. Non-profit LPCs had 89.9% occupancy as compared to for-profit communities, which had 87.2% occupancy for the first quarter of this year.
>> Related: The Great Debate: Rental or Entry Fee Retirement Community?
Trending in the right direction
As we noted, the pandemic had a sizable impact on the senior living industry as a whole. While LPCs were less impacted than certain other senior living segments, they were not immune to the dip in occupancy.
Looking back at a similar report from the fourth quarter of 2019 — just before the onset of the COVID-19 pandemic — we see that life plan communities reported 91.2% overall occupancy and non-LPC properties had 86.3% occupancy. At their lowest during the pandemic, however, entrance fee LPCs’ occupancy dipped below 87%, rental LPCs were at under 80% occupancy, and non-LPCs plummeted to under 75% occupancy.
On the whole, the Zeigler article shows positive news for the life plan community sector of senior living. The industry is steadily recovering with the most recent data from Q1 2024 showing that overall, life plan community occupancy is at 89.2%. Thus, the LPC sector’s overall occupancy is within just a few percentage points of its pre-pandemic numbers.
This is a testament to the resiliency of the senior living industry and perhaps in particular the value that older adults continue to find in the peace of mind offered by LPCs’ continuum of care services.
If you are considering a LPC, it’s important to do your research, including examining the financial strength of the organization. Visit our Resources page to learn more.

FREE Detailed Profile Reports on CCRCs/Life Plan Communities
Search Communities


